CALGARY, ALBERTA - Aug. 3, 2011 /CNW/ - Paramount Resources Ltd. (TSX:POU) ("Paramount" or the "Company") announces its financial and operating results for the three and six months ended June 30, 2011: Second quarter 2011 average sales volumes increase 30 percent to 16,572 Boe/d.
FINANCIAL AND OPERATING HIGHLIGHTS(1)
($ millions, except as noted)
                                  Three months ended     Six months ended
                                  June 30                June 30
                              2011     2010   Change%   2011    2010 Change%
----------------------------------------------------------------------------
Financial(2)
Petroleum and natural gas
 sales                        61.1     44.6       37   107.9    93.5     15
Funds flow from
 operations(3)                23.4     25.2       (7)   37.3    48.7    (23)
 Per share - diluted
  ($/share)                   0.29     0.35      (17)   0.48    0.67    (28)
Net income (loss)             12.2    (17.5)     170     0.3     9.4    (97)
 Per share - basic
  ($/share)                   0.16    (0.24)     167       -    0.13   (100)
 Per share - diluted
  ($/share)                  (0.02)   (0.24)      92   (0.06)   0.13   (146)
Exploration and development
 expenditures                 54.5     17.9      204   214.6    84.7    153
Investments in other
 entities - market value(4)                            783.1   354.8    121
Total assets                                         1,714.5 1,145.6     50
Net debt(5)                                            514.1   184.9    178
Common shares outstanding
 (thousands)                                          79,051  72,434      9

Operating
Sales volumes:
 Natural gas (MMcf/d)         77.7     57.0       36    68.3    53.6     27
 NGLs (Bbl/d)                1,504      821       83   1,237     798     55
 Oil (Bbl/d)                 2,110    2,466      (14)  2,231   2,602    (14)
 Total (Boe/d)              16,572   12,787       30  14,844  12,333     20
Average realized price:
 Natural gas ($/Mcf)          4.43     4.49       (1)   4.36    5.00    (13)
 NGLs ($/Bbl)                83.17    77.26        8   81.66   74.82      9
 Oil ($/Bbl)                 95.64    69.34       38   88.44   72.57     22

Net wells drilled
 (excluding oil sands
 evaluation)                     8        2      300      20      24    (17)
Net oil sands evaluation
 wells drilled                   1        -        -      27      45    (40)
----------------------------------------------------------------------------

1.  Readers are referred to the advisories concerning non-GAAP measures and
    oil and gas definitions in the "Advisories" section of this document.
2.  Paramount adopted International Financial Reporting Standards ("IFRS")
    effective for fiscal years beginning on or after January 1, 2011 and the
    Company has applied IFRS as of January 1, 2010 (the "Transition Date")
    for comparative purposes. Certain prior period amounts have been
    adjusted to reflect the changes in the Company's accounting policies.
3.  The Company has adjusted its funds flow from operations measure for all
    periods presented. Refer to the advisories concerning non-GAAP measures
    in the "Advisories" section of this document.
4.  Based on the period-end closing prices of publicly traded enterprises
    and the book value of the remaining investments.
5.  Net debt is a non-GAAP measure, it is calculated and defined in the
    Liquidity and Capital Resources section of Management's Discussion and
    Analysis.

SECOND QUARTER OVERVIEW

Funds Flow From Operations

--  Second quarter 2011 funds flow from operations was $23.4 million, $1.8
    million lower than the second quarter of 2010, as the impact of higher
    production and a higher netback was more than offset by higher interest,
    cash payments on financial commodity contracts and other corporate
    costs.

Principal Properties

--  Average sales volumes in the second quarter of 2011 increased 30 percent
    to 16,572 Boe/d compared to 12,787 Boe/d in the second quarter of 2010.
    Paramount's average daily sales volumes for the last two weeks of June
    exceeded 20,000 Boe/d.
--  Netback increased 49 percent in the second quarter of 2011 to $34.9
    million from $23.4 million in the second quarter of 2010.
--  The Kaybob corporate operating unit ("COU") increased sales volumes to
    over 10,000 Boe/d in the last two weeks of June.
--  Construction of the 45 MMcf/d processing plant at Musreau is progressing
    on budget with an expected start-up in October. Design work has
    commenced to expand the new facility, once operational, into a 190
    MMcf/d (160 MMcf/d sales gas capacity) deep cut liquids extraction plant
    with an expected start-up in the second quarter of 2013.
--  At Karr-Gold Creek in the Grande Prairie COU, a 22 day shut-down of a
    third-party midstream processing facility that affected approximately
    1,700 Boe/d of the Company's production was resolved during May 2011 and
    the Company is working to restore production from the shut-in wells.
--  Construction of the 10 MMcf/d compression and gathering system at
    Valhalla was completed in June 2011 and the facility commenced
    operations in July 2011.
--  In May 2011, Paramount closed the acquisition of ProspEx Resources Ltd.
    ("ProspEx").

Strategic Investments

--  The market value of Paramount's portfolio of investments in other oil
    and gas entities increased nine percent during the second quarter of
    2011 to $783.1 million.
--  In July 2011, the Company received an updated independent evaluation of
    its bitumen resources within the Grand Rapids formation at the Hoole oil
    sands property in which estimated economic contingent bitumen resources
    increased 20 percent to 763 million barrels (Best Estimate (P50)). The
    before-tax net present value of future net revenue of such economic
    contingent resources, discounted at ten percent (Best Estimate (P50)),
    increased 49 percent to $2.8 billion.
--  Between April 2011 and July 2011 Paramount sold its investments in the
    shares of NuLoch Resources Inc. ("NuLoch") and Magnum Hunter Resources
    Corporation ("Magnum Hunter") for aggregate proceeds of $15.8 million.

Corporate

--  In April 2011, Paramount closed offerings of an aggregate 1.7 million
    Common Shares for gross proceeds of $54.2 million.
--  In June 2011, Paramount renewed and expanded its bank credit facility,
    increasing the total credit limit to $300 million from $160 million.

REVIEW OF OPERATIONS

                                   ----------------
Three months ended                   June 30, 2011  March 31, 2011   Change%
----------------------------------------------------------------------------

SALES VOLUMES
 Natural gas (MMcf/d)                         77.7            58.7       32
 NGLs (Bbl/d)                                1,504             968       55
 Oil (Bbl/d)                                 2,110           2,353      (10)
 Total (Boe/d)                              16,572          13,097       27

NETBACK ($/Boe)
 Petroleum and natural gas sales             40.52           39.67        2
 Royalties                                   (3.46)          (4.01)     (14)
 Operating expense and production
  tax                                       (10.40)         (13.20)     (21)
 Transportation                              (3.52)          (3.47)       1
                                   -----------------------------------------
 Netback                                     23.14           18.99       22
 Financial commodity contract
  settlements                                (0.47)          (0.23)     104
                                   -----------------------------------------
 Netback including financial
  commodity contract settlements             22.67           18.76       21
----------------------------------------------------------------------------
Paramount's average sales volumes increased 27 percent to 16,572 Boe/d in the second quarter of 2011 compared to 13,097 Boe/d in the previous quarter, primarily as a result of production increases in the Kaybob COU and the impact of the ProspEx acquisition (June - 2,850 Boe/d, second quarter - 950 Boe/d). Sales volumes were affected by operational disruptions in the Grande Prairie COU where a third-party processing facility shut-in Karr-Gold Creek production for 22 days and in the Northern COU where a third-party pipeline failure affected liquids sales volumes during the quarter. Paramount's average sales volumes exceeded 20,000 Boe/d during the last two weeks of June.
The second quarter netback per Boe increased 21 percent compared to the previous quarter, primarily because of lower per unit operating costs. The Company's operating costs are normally higher in the first quarter as a result of annual scheduled repair and maintenance programs at winter access locations in the Northern COU.
ProspEx Acquisition
On May 31, 2011, Paramount completed the acquisition of ProspEx; paying $64.8 million in cash and issuing two million Paramount Common Shares.
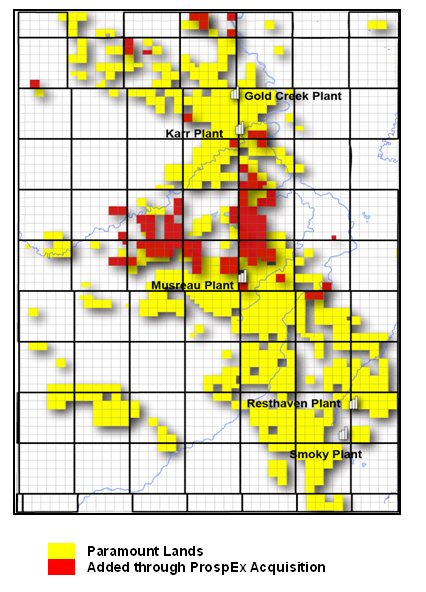
Through the acquisition, Paramount added a suite of high impact liquids-rich natural gas assets with multi-zone and horizontal drilling potential in several zones, including the prolific Falher C zone in the Kakwa area. These assets increase Paramount's Deep Basin land holdings in the Kakwa, Elmworth and Wapiti areas of Alberta. The acquisition also included assets in the Pembina and Brazeau areas and numerous drilling locations in the Birch area of north eastern British Columbia, a liquids-rich Montney gas opportunity. In addition, the acquisition included reserves and production from the Ricinus and Harmattan areas of Alberta.
The following map shows Paramount's Deep Basin lands and the Deep Basin lands added through the acquisition of ProspEx.
To view the map, please follow the link provided: image/2011+Aug+3_map.jpg
KAYBOB

                                     ---------------
Three months ended                     June 30, 2011  March 31, 2011 Change%
----------------------------------------------------------------------------

Sales Volumes
 Natural gas (MMcf/d)                           43.5            27.7     57
 NGLs (Bbl/d)                                    847             535     58
 Oil (Bbl/d)                                     102              95      7
 Total (Boe/d)                                 8,204           5,246     56

Exploration and Development
 Expenditures(1) ($ millions)
 Exploration, drilling, completions
  and tie-ins                                   14.0            45.1    (69)
 Facilities and gathering                        4.4            34.2    (87)
                                     ---------------------------------------
                                                18.4            79.3    (77)

                                       Gross     Net    Gross    Net
                                     -------------------------------
Wells drilled                              5       3       10      6
Wells placed on production                 -       -       11      7
----------------------------------------------------------------------------

1.  Before deduction of Alberta Drilling Royalty credits
Average daily sales volumes in the Kaybob COU in the second quarter of 2011 increased 56 percent to 8,204 Boe/d compared to the prior quarter, and exceeded 10,000 Boe/d in the last two weeks of June 2011. The increase in sales volumes was primarily the result of production from new wells brought on production and incremental production from wells added through the ProspEx acquisition. Performance of the 11 (7.0 net) wells brought on production during 2011 has been consistent with, or exceeded expectations.
Subsequent to quarter end, one (0.5 net) new Montney formation well was completed and brought on production, and Paramount currently has an additional 11 (7.3 net) Dunvegan, Falher and Montney wells awaiting completion and tie-in. The Company expects that by August 2011 it will be operating four drilling rigs on its Deep Basin properties, drilling up to 11 (7.4 net) more wells this year, including three (3.0 net) Montney wells. Regulatory approvals to drill up to eight wells per section have been obtained for a total of 19 sections and additional applications will be submitted as the development of the Company's properties progresses.
The Company is continuing its plans to expand processing capacity in the Deep Basin as current production levels are nearing the limit of the Company's owned and third-party firm service processing capacity. Construction of the new 45 MMcf/d processing plant at Musreau is progressing on-budget and is now expected to start-up in October 2011 as construction activities have been impacted by wet weather conditions. With its continued positive drilling results, the Company has initiated design work to expand the total capacity of the new plant, once operational, to 190 MMcf/d (160 MMcf/d sales gas capacity) and convert it into a deep cut liquids extraction plant. It is anticipated that this expansion will be completed during the second quarter of 2013. The planned expansion of the third-party processing plant at Smoky, for which Paramount has nominated for an incremental 50 MMcf/d of processing capacity, is currently in the engineering and design phase and is expected to be completed in mid-2013.
Paramount anticipates that by the end of 2011 it will have 55 MMcf/d of Company-owned and firm-service third-party processing capacity at Musreau and approximately 20 MMcf/d of Company-owned processing capacity in the Resthaven/Smoky area. The Company will continue to utilize available excess capacity at facilities where Paramount has ownership and utilize interruptible capacity in third-party facilities to maximize production while additional Company-owned capacity is being constructed.
GRANDE PRAIRIE

                                       --------------
Three months ended                      June 30, 2011 March 31, 2011 Change%
----------------------------------------------------------------------------

Sales Volumes
 Natural gas (MMcf/d)                            12.6           13.0     (3)
 NGLs (Bbl/d)                                     560            367     53
 Oil (Bbl/d)                                      448            426      5
 Total (Boe/d)                                  3,108          2,954      5

Exploration and Development
 Expenditures(1) ($ millions)
 Exploration, drilling, completions and
  tie-ins                                        19.0           39.6    (52)
 Facilities and gathering                         9.9           20.8    (52)
                                       -------------------------------------
                                                 28.9           60.4    (52)

                                         Gross    Net   Gross    Net
                                       -----------------------------
Wells drilled                                3      3       7      4
Wells placed on production                   3      3       7      4
----------------------------------------------------------------------------

1.  Before deduction of Alberta Drilling Royalty credits
Average sales volumes in the Grande Prairie COU increased five percent in the second quarter of 2011 to 3,108 Boe/d compared to 2,954 Boe/d in the first quarter of the year, despite a processing disruption at a third-party processing facility and continued wet weather conditions.
KARR-GOLD CREEK
Sales volumes at Karr-Gold Creek were impacted by processing interruptions at a third-party midstream facility which shut-in approximately 1,700 Boe/d of production for 22 days during the quarter. The facility resumed service in mid-May and production volumes are expected to increase during the remainder of 2011 as production from shut-in wells is restored and new wells are brought on production.
Second quarter activities at Karr-Gold Creek included the drilling of one (1.0 net) well and the tie-in of two (2.0 net) wells previously drilled. The completion of an additional three (3.0 net) wells was deferred until the third quarter due to an extended spring break-up and wet weather that impacted construction activities.
Construction of the second phase of the compression/dehydration facility at Karr-Gold Creek has been completed, which brings total dehydration and compression capacity to 40 MMcf/d of sour gas and 8 MMcf/d of sweet gas.
VALHALLA
Two (1.5 net) wells were drilled at Valhalla in the second quarter and construction of the initial 10 MMcf/d phase of a gas gathering and compression system was completed. The start-up of the system was deferred until July as a result of delays in receiving third-party approvals. The Company plans to expand the system to 20 MMcf/d by the end of 2011.
ANTE CREEK
Paramount has drilled two (1.5 net) wells to date at Ante Creek targeting oil from the Montney formation. The first well is producing at approximately 200 Bbl/d (100 Bbl/d net), the maximum currently permitted. The second well is planned to be completed and tied-in during the third quarter. Applications will be made for Good Production Practice to permit wells in Ante Creek to be produced at unrestricted rates. A third Montney oil well is expected to be drilled later in 2011.
SOUTHERN

                                       --------------
Three months ended                      June 30, 2011 March 31, 2011 Change%
----------------------------------------------------------------------------

Sales Volumes
 Natural gas (MMcf/d)                            10.6            8.7     22
 NGLs (Bbl/d)                                      90             51     76
 Oil (Bbl/d)                                    1,477          1,435      3
 Total (Boe/d)                                  3,333          2,939     13

Exploration and Development
 Expenditures(1) ($ millions)
 Exploration, drilling, completions and
  tie-ins                                         1.8            3.0    (40)
 Facilities and gathering                         0.5            1.8    (72)
                                       -------------------------------------
                                                  2.3            4.8    (52)

                                         Gross    Net   Gross    Net
                                       -----------------------------
Wells drilled                                5      2       3      1
Wells placed on production                   2      2      15     12
----------------------------------------------------------------------------

1.  Before deduction of Alberta Drilling Royalty credits
Southern COU average sales volumes increased by 13 percent in the second quarter of 2011 to 3,333 Boe/d compared to 2,939 Boe/d in the prior quarter as a result of production additions from the ProspEx acquisition and new wells in Chain.
Second quarter 2011 activities in southern Alberta included the tie-in of two (2.0 net) Chain area coal bed methane wells. At Enchant, the drilling of three oil wells planned for the second quarter was deferred to the third quarter due to rig availability.
In southern Saskatchewan, Paramount's joint development partner brought its initial three Viking light oil wells on production. Paramount will have a post-payout interest of 45 percent in these wells. An additional 4 (1.8 net) wells were drilled in the second quarter and will be completed later in 2011.
In May 2011, drilling of a fourth well began under the North Dakota joint development project.
NORTHERN

                                       --------------
Three months ended                      June 30, 2011 March 31, 2011 Change%
----------------------------------------------------------------------------

Sales Volumes
 Natural gas (MMcf/d)                            11.0            9.3     18
 NGLs (Bbl/d)                                       7             15    (53)
 Oil (Bbl/d)                                       83            397    (79)
 Total (Boe/d)                                  1,927          1,958     (2)

Exploration and Development
 Expenditures(1)($ millions)
 Exploration, drilling, completions and
  tie-ins                                         2.4            9.9     76
 Facilities and gathering                         0.1            2.9     97
 ---------------------------------------------------------------------------
                                                  2.5           12.8     80

                                         Gross    Net   Gross    Net
                                       -----------------------------
Wells drilled                                -      -       2      2
Wells placed on production                   -      -       2      2
----------------------------------------------------------------------------

1.  Before deduction of Alberta Drilling Royalty credits
Average sales volumes in the Northern COU during the second quarter of 2011 were unchanged from the first quarter of the year, as decreases in sales volumes resulting from natural declines and a third-party pipeline failure were offset by new production from wells brought on during the first quarter. The third-party pipeline was shut-down at the end of April, and has not yet received regulatory approval to resume service.
As part of the ProspEx acquisition, the Company added approximately 22,500 net acres of undeveloped land in the Birch area of north east British Columbia, which is prospective for a liquids-rich Montney natural gas play. In the third quarter of 2011, Paramount expects to complete a horizontal exploratory well that had been drilled by ProspEx.
STRATEGIC INVESTMENTS
In July 2011, Paramount received an updated independent evaluation of its bitumen resources within the Grand Rapids formation at the Hoole oil sands property from the Company's independent reserves evaluator, McDaniel & Associates Consultants Ltd. ("McDaniel"), who had previously evaluated the Hoole oil sands property effective April 30, 2010. This update was undertaken to include the results of Paramount's 15 well 2010/2011 winter delineation drilling program, which increased the mapped thickness of the reservoir in some areas, confirmed the continuous nature of the reservoir and extended the boundaries of the exploitable reservoir.
The tables below summarize McDaniel's updated evaluation of the estimated volumes and net present values attributable to Paramount's 100 percent interest in the economic contingent bitumen resources in the Grand Rapids formation at Hoole as of April 30, 2011, and current estimates of initial and fully developed production from such interests. Economic contingent bitumen resources in the Grand Rapids formation and the associated net present values were determined assuming a conventional Steam-Assisted Gravity Drainage development scenario. Potentially exploitable bitumen accumulations within other prospective formations in the Hoole oil sands properties were not included in McDaniel's evaluation.
                                         Economic
                                       Contingent                     Fully
                                        Resources      Initial    Developed
Category / Level of          DEBIP(1)       (2)(3)  Production   Production
 Certainty (6)              (MBbl)(4)    (MBbl)(4)   (Bbl/d)(5)   (Bbl/d)(5)
----------------------------------------------------------------------------
High Estimate              1,821,614      952,544       27,000      105,000
Best Estimate              1,631,742      762,661       26,000       80,000
Low Estimate               1,320,406      552,094       25,000       60,000
----------------------------------------------------------------------------

1.  DEBIP means Discovered Exploitable Bitumen In-Place.  Discovered
    Exploitable Bitumen In-Place is the estimated volume of bitumen, as of a
    given date, which is contained in a subsurface stratigraphic interval of
    a known accumulation that meets or exceeds certain reservoir
    characteristics, such as minimum continuous net pay, porosity, and mass
    bitumen content, considered necessary for the commercial application of
    known recovery technologies.  There is no certainty that it will be
    commercially viable to produce any portion of the resources.
2.  Represents the Company's share of recoverable volumes before deduction
    of royalties. In the assessment of contingent resources within the Hoole
    oil sands properties, McDaniel used a minimum net pay cut-off of 10
    meters in the best estimate case.
3.  Refer to the advisories section at the end of this document for further
    information concerning contingent resources, including economic
    contingent resources.
4.  MBbl means thousands of barrels.
5.  Bbl/d means barrels per day.  Initial production means the average daily
    production rate during the first year of production.  Estimates of
    production rates assume that production will commence in 2015 and fully
    developed production will be reached in 2016 for the low estimate, 2017
    for the best estimate and 2018 for the high estimate.
6.  Refer to the advisories section at the end of this document for a
    description of such categories.


                           NPV(1)of Future Net Revenue ($MM)(2)
                                      Discounted At                   NPV(1)
                         --------------------------------------- Discounted
Category / Level of                                                   at 10%
 Certainty (4)                   0%        5%        8%       10% ($/Bbl)(3)
----------------------------------------------------------------------------
High Estimate               22,884     9,452     5,862     4,336       4.55
Best Estimate               16,522     6,549     3,935     2,834       3.72
Low Estimate                10,454     4,026     2,321     1,602       2.90
----------------------------------------------------------------------------

1.  NPV means net present value and represents the Company's share of future
    net revenue, before the deduction of income tax from the economic
    contingent bitumen resources in the Grand Rapids formation within the
    Hoole oil sands properties.  The calculation considers such items as
    revenues, royalties, operating costs, abandonment costs and capital
    expenditures.  Royalties have been calculated based on Alberta's Royalty
    Framework applicable to oil sands projects in Alberta. The calculation
    does not consider financing costs and general and administrative costs.
    All NPVs are calculated assuming natural gas is used as a fuel for steam
    generation.  Revenues and expenditures were calculated based on
    McDaniel's forecast prices and costs as of April 1, 2011.
2.  $MM means millions of Canadian dollars.
3.  $/Bbl means Canadian dollars per barrel.
4.  Refer to the advisories section at the end of this document for a
    description of such categories.
During the remainder of 2011, the Company expects to finalize its plans for the initial development of the Hoole oil sands properties, complete the engineering design and environmental impact analysis for the project and submit a regulatory application for commercial development of the resource. The Company has continued to analyze and interpret the data collected in the first quarter drilling and delineation program, including performing a steam coreflood in order to confirm the quality and characteristics of the reservoir.
Paramount continues to interpret the results of its winter drilling program at Saleski, with an emphasis on the analysis of the recovered cores. Paramount has commissioned an independent evaluation of the Saleski property, which is expected to be received in the fourth quarter of 2011.
Paramount is developing plans to begin drilling operations on its shale gas properties in the 2011/2012 winter drilling season, with the first well being planned for the Dunedin area of north east British Columbia. The Company purchased seismic data in the first quarter of 2011 covering a substantial portion of its shale gas acreage which will be incorporated in further studies and planning for future projects.
OUTLOOK
Paramount's 2011 annual capital spending budget (excluding land and acquisitions) remains at $450 million, with $425 million allocated to exploration and development spending in the Company's core producing areas and $25 million allocated to the Hoole oil sands and Saleski carbonate bitumen areas. The Company has flexibility within its current capital plan to increase or decrease spending depending upon future economic conditions, among other factors.
Average sales volumes for the last two weeks of June 2011 increased to over 20,000 Boe/d and further increases in sales volumes are expected throughout the second half of the year as additional wells and facilities are brought on production. A wet spring and summer, combined with disruptions at third-party facilities, have impacted the timing of some of the Company's planned field activities and subsequent expected production additions. The Company continues to forecast a 2011 exit rate of approximately 28,000 Boe/d.
ADDITIONAL INFORMATION
A copy of Paramount's complete results for the three and six months ended June 30, 2011, including Management's Discussion and Analysis and the Unaudited Interim Consolidated Financial Statements can be obtained at download/2011+Aug+3.pdf. These documents will also be made available through Paramount's website at www.paramountres.com and SEDAR at www.sedar.com.
ABOUT PARAMOUNT
Paramount is a Canadian oil and natural gas exploration, development and production company with operations focused in Western Canada. Paramount's common shares are listed on the Toronto Stock Exchange under the symbol "POU".
ADVISORIES
Forward-looking Information
Certain statements in this document constitute forward-looking information under applicable securities legislation. Forward-looking information typically contains statements with words such as "anticipate", "believe", "estimate", "expect", "plan", "intend", "propose", or similar words suggesting future outcomes or an outlook. Forward looking information in this document includes, but is not limited to:
--  expected production volumes and the timing thereof;
--  planned exploration and development expenditures, and the timing
    thereof;
--  development plans for Paramount's oil sands leases and the projected
    timeline for finalizing such plans;
--  exploration and development plans and strategies;
--  budget allocations and capital spending flexibility;
--  adequacy of facilities to process natural gas production;
--  estimated resources and the undiscounted and discounted net present
    value of future net revenues from such resources (including the forecast
    prices and costs and the timing of expected production volumes and
    future development capital);
--  estimated initial and fully developed production from the oil sands
    leases and the timing thereof;
--  timing of regulatory applications;
--  ability to fulfill future pipeline transportation commitments;
--  undeveloped land lease expiries;
--  timing and cost of future abandonment and reclamation;
--  business strategies and objectives;
--  sources of and plans for financing;
--  acquisition and disposition plans;
--  operating and other costs and royalty rates;
--  expected drilling programs, well tie-ins, facility construction and
    expansions, completions and the timing thereof; and
--  the outcome of any legal claims, audits, assessments or other regulatory
    matters or proceedings.
Such forward-looking information is based on a number of assumptions which may prove to be incorrect. The following assumptions have been made, in addition to any other assumptions identified in this document:
--  future crude oil, bitumen and natural gas prices and general economic
    and business conditions;
--  the ability of Paramount to obtain required capital to finance its
    exploration, development and operations;
--  the ability of Paramount to obtain equipment, services, supplies and
    personnel in a timely manner to carry out its activities;
--  the ability of Paramount to market its oil and natural gas successfully
    to current and new customers;
--  estimates of input and labour costs for an oil sands project;
--  the ability of Paramount to secure adequate product transportation and
    storage;
--  the ability of Paramount and its industry partners to obtain drilling
    success consistent with expectations;
--  the timely receipt of required regulatory approvals;
--  estimated timelines being met in respect of the development of the Hoole
    oil sands properties;
--  access to capital markets and other sources of funding; and
--  currency exchange and interest rates.
Although Paramount believes that the expectations reflected in such forward looking information is reasonable, undue reliance should not be placed on it as Paramount can give no assurance that such expectations will prove to be correct. Forward-looking information is based on current expectations, estimates and projections that involve a number of risks and uncertainties which could cause actual results to differ materially from those anticipated by Paramount and described in the forward looking information. These risks and uncertainties include, but are not limited to:
--  fluctuations in crude oil, bitumen, natural gas and NGLs prices, foreign
    currency exchange rates and interest rates;
--  the uncertainty of estimates and projections relating to future revenue,
    future production, costs and expenses and the timing thereof;
--  the ability to secure adequate product processing, transportation and
    storage;
--  the uncertainty of exploration, development and drilling;
--  operational risks in exploring for, developing and producing crude oil
    and natural gas, and the timing thereof;
--  the ability to obtain equipment, services, supplies and personnel in a
    timely manner;
--  potential disruption or unexpected technical difficulties in designing,
    developing or operating new or existing facilities;
--  risks and uncertainties involving the geology of oil and gas deposits;
--  the uncertainty of reserves and resource estimates;
--  the ability to generate sufficient cash flow from operations and other
    sources of financing at an acceptable cost to meet current and future
    obligations, including costs of anticipated projects;
--  changes to the status or interpretation of laws, regulations or
    policies;
--  changes in environmental laws including emission reduction obligations;
--  the receipt and timing of governmental or regulatory approvals;
--  changes in general business and economic conditions;
--  uncertainty regarding aboriginal land claims and co-existing with local
    populations;
--  the effects of weather;
--  the ability to fund exploration, development and operational activities
    and meet current and future obligations;
--  the timing and cost of future abandonment and reclamation activities;
--  cleanup costs or business interruptions due environmental damage and
    contamination;
--  the ability to enter into or continue leases;
--  existing and potential lawsuits and regulatory actions; and
--  other risks and uncertainties described elsewhere in this document and
    in Paramount's other filings with Canadian securities authorities,
    including its Annual Information Form.
The foregoing list of risks is not exhaustive. Additional information concerning these and other factors which could impact Paramount are included in Paramount's most recent Annual Information Form. The forward-looking information contained in this document is made as of the date hereof and, except as required by applicable securities law, Paramount undertakes no obligation to update publicly or revise any forward-looking statements or information, whether as a result of new information, future events or otherwise.
Non-GAAP Measures
In this document "Funds flow from operations", "Funds flow from operations per share - diluted", "Netback", "Netback including financial commodity contract settlements", "Net Debt", "Exploration and development expenditures" and "Investments in other entities - market value", collectively the "Non-GAAP measures", are used and do not have any standardized meanings as prescribed by Canadian Generally Accepted Accounting Principles ("GAAP").
The Company has adjusted its funds flow from operations measure for all periods subsequent to the Transition Date to exclude asset retirement obligation settlements, cash outflows related to the purchase of Paramount's Common Shares under the Company's stock incentive plan and the effect of changes in foreign exchange rates in respect of foreign currency cash and cash equivalent balances. Funds flow from operations refers to cash from operating activities before net changes in operating working capital, geological and geophysical expenses and asset retirement obligation settlements. Funds flow from operations is commonly used in the oil and gas industry to assist management and investors in measuring the Company's ability to finance capital programs and meet financial obligations.
Netback equals petroleum and natural gas sales less royalties, operating costs, production taxes and transportation costs. Netback is commonly used by management and investors to compare the results of the Company's oil and gas operations between periods. Net Debt is a measure of the Company's overall debt position after adjusting for certain working capital amounts and is used by management to assess the Company's overall leverage position. Refer to the calculation of Net Debt in the liquidity and capital resources section of Management's Discussion and Analysis. Exploration and development expenditures refers to capital expenditures incurred by the Company's COUs (excluding land and property acquisitions). The exploration and development expenditure measure provides management and investors with information regarding the Company's Principal Property spending on drilling and infrastructure projects, separate from land and property acquisition activity.
Investments in other entities - market value reflects the Company's investments in enterprises whose securities trade on a public stock exchange at their period end closing price (e.g. Trilogy Energy Corp., MEG Energy Corp., MGM Energy Corp. and others), and all other investments in other entities at book value. Paramount provides this information in its MD&A because the market values of equity-accounted investments, which are significant assets of the Company, are often materially different than their carrying values.
Non-GAAP measures should not be considered in isolation or construed as alternatives to their most directly comparable measure calculated in accordance with GAAP, or other measures of financial performance calculated in accordance with GAAP. The Non-GAAP measures are unlikely to be comparable to similar measures presented by other issuers.
Oil and Gas Measures and Definitions
This document contains disclosure expressed as "Boe" and "Boe/d". All oil and natural gas equivalency volumes have been derived using the ratio of six thousand cubic feet of natural gas to one barrel of oil. Equivalency measures may be misleading, particularly if used in isolation. A conversion ratio of six thousand cubic feet of natural gas to one barrel of oil is based on an energy equivalency conversion method primarily applicable at the burner tip and does not represent a value equivalency at the well head.
This document contains disclosure of certain results of an updated independent evaluation of the Company's contingent bitumen resources from the Grand Rapids formation within the Company's Hoole oil sands property as of April 30, 2011 by McDaniel (the "McDaniel Evaluation"). "Contingent resources" are those quantities of bitumen resources estimated, as of a given date, to be potentially recoverable from known accumulations using established technology or technology under development, but are classified as a resource rather than a reserve due to one or more contingencies, such as the absence of regulatory approvals, detailed design estimates or near term development plans. There is no certainty that it will be commercially viable to produce any portion of the contingent resources. For Paramount, contingencies which must be overcome to enable the reclassification of bitumen contingent resources as reserves include finalization of plans for the initial development of the Hoole oil sands properties, regulatory application submission with no major issues raised, access to capital markets and other sources of funding, and intent to proceed by Paramount evidenced by a development plan with major capital expenditures. "Economic contingent resources" are those contingent bitumen resources that are currently economically recoverable based on specific forecasts of commodity prices and costs. There is no certainty that it will be commercially viable to produce any portion of the economic contingent resources. "Best estimate" is considered to be the best estimate of the quantity of resources that will actually be recovered. It is equally likely that the actual remaining quantities recovered will be greater or less than the best estimate. Those resources that fall within the best estimate have a 50 percent confidence level that the actual quantities recovered will equal or exceed the estimate. "Low estimate" is considered to be a conservative estimate of the quantity of resources that will actually be recovered. It is likely that the actual remaining quantities recovered will exceed the low estimate. Those resources at the low end of the estimate range have the highest degree of certainty - a 90 percent confidence level - that the actual quantities recovered will equal or exceed the estimate. "High estimate" is considered to be an optimistic estimate of the quantity of resources that will actually be recovered. It is unlikely that the actual remaining quantities of resources recovered will meet or exceed the high estimate. Those resources at the high end of the estimate range have a lower degree of certainty - a 10 percent confidence level - that the actual quantities recovered will equal or exceed the estimate. The volume of economic contingent resources disclosed represents the Company's share of recoverable volumes before the deduction of royalties.
This document contains certain disclosures of net present values ("NPV") from the McDaniel Evaluation. The NPVs disclosed represent the Company's share of future net revenue, before the deduction of income tax from the economic contingent bitumen resources in the Grand Rapids formation within the Hoole oil sands properties. The calculation considers such items as revenues, royalties, operating costs, abandonment costs and capital expenditures. Royalties were calculated based on Alberta's Royalty Framework applicable to oil sands projects in Alberta. The calculation does not consider financing costs and general and administrative costs. The NPVs were calculated assuming natural gas is used as a fuel for steam generation. Revenues and expenditures were calculated based on McDaniel's forecast prices and costs as of April 1, 2011. The estimated net present value of economic contingent resources disclosed does not represent fair market value.

