CALGARY, ALBERTA - March 6, 2012 /CNW/ - Paramount Resources Ltd. (TSX:POU)
2011 OVERVIEW
Principal Properties
- Proved reserves increased by 39 percent to 35.7 MMBoe. Proved plus probable reserves increased by 32 percent to 53.0 MMBoe. The Company replaced 193 percent of 2011 production.
- Proved plus probable finding and development costs, excluding facilities and gathering system construction costs, were $24.19/Boe for the Company and $13.57/Boe for the Kaybob COU.
- Average sales volumes in 2011 increased 34 percent to 17,426 Boe/d. Netback increased 34 percent to $127.8 million in 2011 compared to $95.1 million in 2010.
- The Kaybob COU increased its sales volumes by 86 percent to 8,361 Boe/d in 2011 compared to 4,495 Boe/d in 2010. Construction of phase two of the Musreau facility, an incremental 200 MMcf/d deep cut liquids extraction plant, will begin in 2012. Procurement of long lead-time equipment has already commenced.
- In May 2011, Paramount completed its acquisition of ProspEx Resources Ltd. ("ProspEx"), adding significant land holdings and producing assets in the Deep Basin at Kakwa, Elmworth and Wapiti and land holdings at Pembina and Brazeau in Southern Alberta.
- The Southern COU divested non-core properties during the first quarter of 2012 at West Pembina, Alberta and Kindersley, Saskatchewan for total proceeds of approximately $50 million.
- In the first quarter of 2012 Paramount and its wholly-owned subsidiary Summit Resources, Inc. ("Summit") initiated a process to sell Summit and its United States properties.
Strategic Investments
- The market value of Paramount's portfolio of investments in other oil and gas entities increased 114 percent to $1.1 billion at December 31, 2011, primarily due to an increase in the market price of Trilogy Energy Corp. ("Trilogy") shares. In January 2012, Paramount received $189.5 million in gross proceeds from the sale of 5.0 million of its 24.1 million Trilogy shares.
- In July 2011, the Company received an updated independent evaluation of its bitumen resources within the Grand Rapids formation at its Hoole oil sands property. Estimated economic contingent bitumen resources increased 20 percent from the April 2010 evaluation to 763 million barrels (Best Estimate (P50)). The before- tax net present value of future net revenue of such economic contingent resources, discounted at ten percent (Best Estimate (P50)), increased 49 percent to $2.8 billion.
- In November 2011, Paramount reorganized all of the Company's oil sands and carbonate bitumen interests into a new wholly-owned subsidiary; Cavalier Energy Inc. ("Cavalier Energy"). The reorganization was undertaken to create a focused, self-funding oil sands entity in order to accelerate the development of Paramount's bitumen interests.
Corporate
- Between December 2010 and November 2011, Paramount raised approximately $650 million through debt and equity issuances, providing financial flexibility to support the Company's plans for a large-scale Deep Basin liquids-rich natural gas development and strengthening its balance sheet.
- General and administrative costs per Boe decreased 17 percent in 2011 to $2.66 per Boe compared to $3.19 per Boe in 2010.
FINANCIAL AND OPERATING HIGHLIGHTS (1)
| Three months ended | |||||||||||||
| December 31 | Year ended December 31 | ||||||||||||
| ($ millions, except as noted) | 2011 | 2010 | % Change |
2011 | 2010 | % Change |
|||||||
| Financial | |||||||||||||
| Petroleum and natural gas sales | 63.3 | 46.0 | 38 | 241.7 | 184.4 | 31 | |||||||
| Funds flow from operations(2) | 26.1 | 21.3 | 23 | 96.2 | 94.0 | 2 | |||||||
| Per share - basic and diluted ($/share) | 0.33 | 0.29 | 14 | 1.23 | 1.29 | (5) | |||||||
| Net loss | (209.9) | (106.3) | (97) | (232.0) | (90.0) | (158) | |||||||
| Per share - basic and diluted ($/share) | (2.54) | (1.44) | (76) | (2.96) | (1.24) | (139) | |||||||
| Exploration and development expenditures | 144.1 | 78.6 | 83 | 465.7 | 199.0 | 134 | |||||||
| Investments in other entities - market value(3) | 1,077.3 | 502.9 | 114 | ||||||||||
| Total assets | 1,725.7 | 1,391.3 | 24 | ||||||||||
| Net debt | 513.4 | 295.2 | 74 | ||||||||||
| Common shares outstanding (thousands) | 85,500 | 75,183 | 14 | ||||||||||
| Operating | |||||||||||||
| Sales volumes | |||||||||||||
| Natural gas (MMcf/d) | 91.5 | 60.4 | 51 | 81.6 | 57.7 | 41 | |||||||
| NGLs (Bbl/d) | 1,620 | 1,030 | 57 | 1,542 | 932 | 65 | |||||||
| Oil (Bbl/d) | 2,356 | 2,357 | - | 2,291 | 2,485 | (8) | |||||||
| Total (Boe/d) | 19,223 | 13,461 | 43 | 17,426 | 13,029 | 34 | |||||||
| Gas weighting | 79% | 75% | 78% | 74% | |||||||||
| Average realized price | |||||||||||||
| Natural gas ($/Mcf) | 3.65 | 4.04 | (10) | 4.10 | 4.50 | (9) | |||||||
| NGLs ($/Bbl) | 81.27 | 75.52 | 8 | 82.24 | 70.58 | 17 | |||||||
| Oil ($/Bbl) | 94.33 | 75.45 | 25 | 87.81 | 72.30 | 21 | |||||||
| Net wells drilled | 13 | 9 | 44 | 75 | 88 | (15) | |||||||
| Net undeveloped land (thousands of acres) | 1,225 | 1,198 | 2 | ||||||||||
| Reserves(4) | |||||||||||||
| Proved plus probable | |||||||||||||
| Natural gas (Bcf) | 244.1 | 181.8 | 34 | ||||||||||
| Crude oil and NGLs (MBbl) | 12,333 | 9,782 | 26 | ||||||||||
| Total (MBoe) | 53,015 | 40,087 | 32 | ||||||||||
| Finding and development costs before facilities expenditures (proved plus probable) ($/boe) | 24.19 | 20.76 | 17 | ||||||||||
| Reserves replacement (proved plus probable) | 193% | 160% | |||||||||||
| NPV future net revenue before tax @ 10% | |||||||||||||
| Proved | 611.4 | 397.8 | 54 | ||||||||||
| Proved plus probable | 832.2 | 556.0 | 50 | ||||||||||
(1) Readers are referred to the advisories concerning non-GAAP measures and oil and gas measures and definitions in the "Advisories" section of this document.
(2) The Company has adjusted its funds flow from operations measure for all periods presented. Refer to the advisories concerning non-GAAP measures in the "Advisories" section of this document.
(3) Based on the period-end closing prices of publicly traded enterprises and book value of the remaining investments.
(4) Working interest reserves before royalty deductions, using forecast prices and costs.
REVIEW OF OPERATIONS
| KAYBOB | 2011 | 2010 | % Change | ||
| Sales Volumes | |||||
| Natural Gas (MMcf/d) | 44.5 | 23.5 | 89 | ||
| NGLs (Bbl/d) | 868 | 495 | 75 | ||
| Oil (Bbl/d) | 72 | 79 | (9) | ||
| Total (Boe/d) | 8,361 | 4,495 | 86 | ||
| Exploration and Development Expenditures(1)($ millions) | |||||
| Exploration, drilling, completions and tie-ins | 171.2 | 61.8 | 177 | ||
| Facilities and gathering | 91.6 | 14.4 | 536 | ||
| 262.8 | 76.2 | 245 | |||
| Gross | Net | Gross | Net | |
| Total Land Holdings (sections) | 792 | 441 | 703 | 474 |
| Wells drilled | 28 | 18 | 16 | 7 |
(1) Before the deduction of Alberta Drilling Royalty credits.
The Kaybob corporate operating unit ("COU") operates in West Central Alberta, where its core properties are in the Deep Basin at Musreau, Smoky and Resthaven. The Company has assembled an extensive land holding of 792 (441 net) sections with varying rights to multiple formations from the Cretaceous to the Montney. With well densities of up to eight wells per section per formation forecast to be required to recover these resources, Paramount's Deep Basin land position represents a multi-decade inventory of drilling locations.
Paramount is executing a large-scale development on these lands that is expected to significantly increase the Kaybob COU's production volumes. The Company's drilling activities over the past few years have substantially de-risked the Cretaceous Dunvegan and Falher formations, which are high pressure, liquids rich, tight gas formations with large reserves potential. With the high liquids content in these formations, these plays continue to be economic despite the current low natural gas price environment. Paramount has also continued the evaluation of its Montney holdings, a deeper horizon in which the Company's initial wells have exhibited higher liquids yields than the Cretaceous zones and are expected to provide higher rates of return despite higher drilling costs related to increased depths. A combination of Cretaceous and Montney opportunities will support the Company's accelerated development plans and the construction of deep-cut processing facilities.
Average daily sales volumes in the Kaybob COU during 2011 were 8,361 Boe/d, an increase of 86 percent compared to 2010. The increase was primarily the result of new wells being brought on in Musreau and Resthaven, and wells added through the acquisition of ProspEx. During the year, the Kaybob COU reached the limit of its available owned capacity, contracted firm service capacity and interruptible processing capacity, which resulted in the temporary shut-in of a number of wells. In mid-December the Company completed construction of its new 45 MMcf/d processing facility at Musreau. A key electrical component within the facility failed shortly after start-up, resulting in the plant having to be shut-down for repairs. Commissioning of the facility is underway, and gas sales are expected to recommence in mid-March.
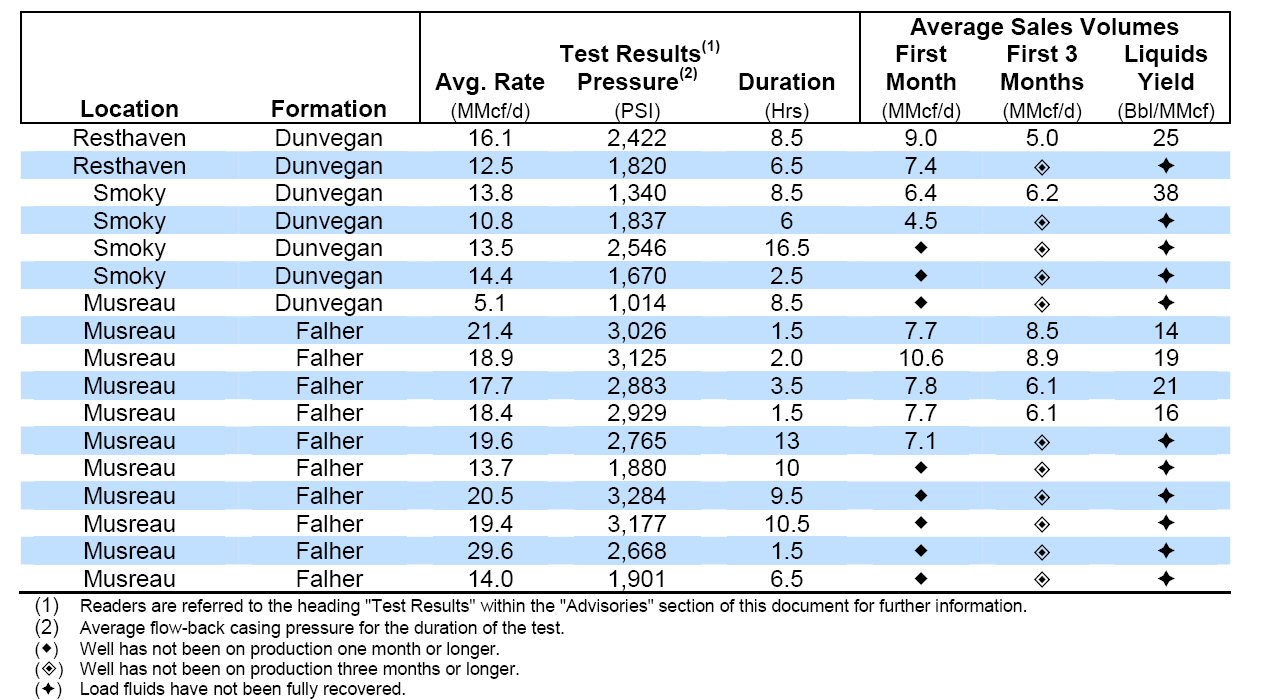
During 2011 the Kaybob COU drilled 28 (18.3 net) wells, completed and tied-in 17 (10.0 net) wells, including 10 (6.8 net) operated Falher and Dunvegan wells. Subsequent to year-end, an additional seven (3.8 net) Falher and Dunvegan wells were completed, of which three (3.0 net) were equipped and tied-in. Some of these wells are shut-in in preparation for the Musreau plant to be ramped up to design capacity before they are brought on production. Paramount currently has an additional two (2.0 net) Falher and Dunvegan wells awaiting completion and tie-in. The following table summarizes test results and average natural gas sales volumes for operated Cretaceous wells rig released during 2011:
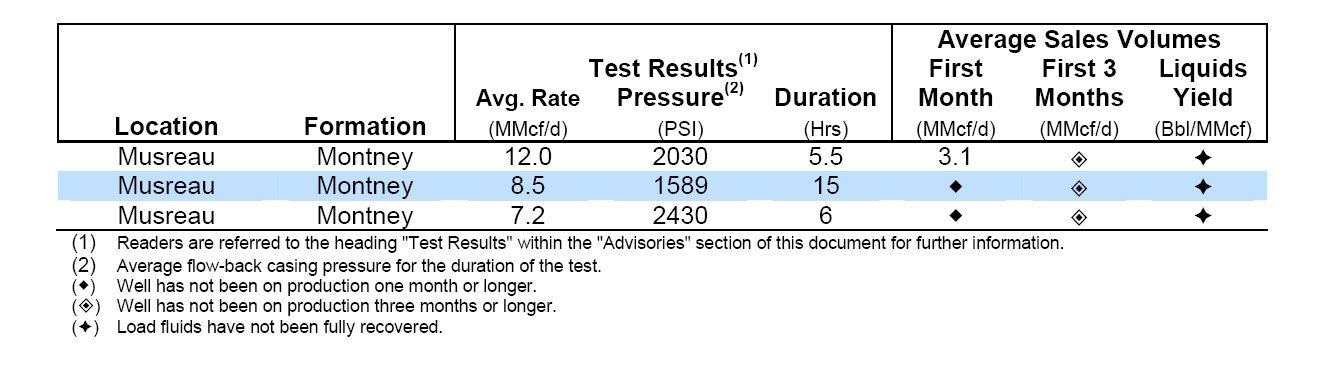
The Company has assembled a total of 209 (176 net) sections of Montney rights, and has drilled and completed five (4.5 net) horizontal wells to date. The first Montney well (0.5 net) was tied-in during 2011, with sales volumes averaging approximately 4.1 MMcf/d of natural gas and 79 Bbl/MMcf of NGLs over its first 90 days of production. The company anticipates two (2.0 net) Montney wells will be brought on production in the third quarter of 2012. The following table summarizes test results and average natural gas sales volumes for operated Montney wells rig released during 2011:
The Kaybob COU is currently operating four drilling rigs on its Deep Basin properties, and the Company has commissioned the construction of an additional two triple-sized walking rigs to be owned and operated by Fox Drilling Inc. ("Fox Drilling"), a wholly-owned subsidiary of Paramount, that are expected to drill on the Kaybob lands during the 2012/2013 winter drilling season. The Company plans to drill and complete additional wells throughout 2012 and 2013 in preparation for new processing capacity that will be added during the second half of 2013, and in the interim will produce volumes held behind pipe on interruptible service to maximize value. The Kaybob COU currently anticipates drilling up to 27 (18.3 net) wells in 2012, including up to five (4.0 net) Montney wells.
Design and procurement of long lead-time equipment has commenced for phase two of the Musreau processing facility, an incremental 200 MMcf/d deep cut liquids extraction facility. Construction is anticipated to begin this fall once regulatory approvals have been obtained. The incremental capacity will be used to process Paramount natural gas as well as third party natural gas for a fee. It is anticipated that construction of this second phase will be completed during the second half of 2013 at an estimated cost of $180 million. The addition of deep cut facilities will add significant value to Paramount's natural gas production due to the price premium realized from the extraction and sale of additional NGLs volumes that would otherwise be sold as slightly higher heat content natural gas.
At Smoky, procurement activities relating to the expansion of a non-operated processing plant have also commenced, with orders being placed for long lead-time components. The existing 100 MMcf/d (10 MMcf/d net) facility is being expanded to 300 MMcf/d (60 MMcf/d net) and upgraded to operate as a deep cut liquids extraction facility. Initially, compression capacity for 200 MMcf/d will be installed, with an additional 100 MMcf/d of compression to be added when production volumes warrant the investment, thereby deferring a portion of the capital costs. The expansion is expected to be completed in late-2013.
With the start-up of the first phase of the Musreau plant, Paramount will have 49 MMcf/d of Company owned capacity and 10 MMcf/d of firm-service third-party processing capacity in Musreau-Kakwa. Paramount also has 20 MMcf/d of Company-owned processing capacity in the Resthaven-Smoky area. Throughout 2012 and into 2013, the Company expects to have an aggregate of 79 MMcf/d of Company-owned and third party firm service capacity and will utilize interruptible service where available until the expansions of the Musreau and Smoky plants are completed. Paramount currently has access to an additional 10 to 12 MMcf/d of interruptible capacity at Musreau/Cutbank.
The Kaybob COU's current and expected future Company-owned and firm-service third-party processing capacity in the Deep Basin is as follows:
| Gross | Net Paramount | Net Paramount | ||||
| Raw Gas | Raw Gas | Estimated Sales | ||||
| Plant Capacity | Plant Capacity | Plant Capacity(1) | ||||
| Current Capacity | (MMcf/d) | (MMcf/d) | (Boe/d) | |||
| Musreau - Operated | 45 | 45 | 8,600 | |||
| Kakwa - Non-operated | 40 | 4 | 720 | |||
| Musreau/Cutbank - Contracted firm service | 10 | 10 | 1,800 | |||
| Resthaven - Non-operated | 20 | 10 | 1,800 | |||
| Smoky Plant - Non-operated | 100 | 10 | 1,800 | |||
| 215 | 79 | 14,720 | ||||
| Future Capacity | ||||||
| Musreau Phase II Deep-Cut - Operated | 200 | 200 | 50,000 | |||
| Smoky/Resthaven Deep-Cut - Non-operated | 200 | 30 | 6,750 | |||
| 400 | 230 | 56,750 | ||||
| Total - Year-end 2013 | 615 | 309 | 71,470 | |||
| (1) Estimated | ||||||
| GRANDE PRAIRIE | 2011 | 2010 | % Change | ||
| Sales Volumes | |||||
| Natural Gas (MMcf/d) | 16.0 | 12.4 | 29 | ||
| NGLs (Bbl/d) | 505 | 367 | 38 | ||
| Oil (Bbl/d) | 393 | 583 | (33) | ||
| Total (Boe/d) | 3,568 | 3,012 | 18 | ||
| Exploration and Development Expenditures(1)($ millions) | |||||
| Exploration, drilling, completions and tie-ins | 106.4 | 81.6 | 30 | ||
| Facilities and gathering | 49.6 | 28.8 | 72 | ||
| 156.0 | 110.4 | 41 | |||
| Gross | Net | Gross | Net | ||
| Total Land Holdings (sections) | 629 | 430 | 703 | 474 | |
| Wells drilled | 22 | 15 | 16 | 14 | |
(1) Before the deduction of Alberta Drilling Royalty credits.
The Grande Prairie COU operates in the Peace River Arch area of Alberta. Core producing areas include Karr-Gold Creek, Valhalla and Mirage. Average daily sales volumes in the Grande Prairie COU during 2011 were 3,568 Boe/d, an increase of 18 percent compared to 2010. The increase was primarily the result of production increases in Valhalla as a new gathering and compression system was brought on stream and at Karr-Gold Creek.
VALHALLA
Valhalla is located approximately 70 km northwest of Grande Prairie. Paramount owns approximately 67 (47 net) sections of land in this area which has multi-zone potential, including in the Montney and Lower Doig formations. The Company's activities at Valhalla accelerated in 2011, with the drilling of 8 (5.7 net) wells and 7 (5.3 net) wells being brought on production. The wells drilled in 2011, which primarily target the Montney formation, have yielded promising results, with significant liquids yields.
A new 10 MMcf/d compression and gathering system was commissioned in the second quarter of 2011. Construction of an expansion to this system to bring total capacity to 28 MMcf/d is near completion and expected to be operational in the second quarter of 2012. Due to capacity constraints four (2.2 net) wells have been temporarily shut-in and will be re-started when the expanded compression capacity is available.
The Grande Prairie COU plans to drill up to 9 (5.0 net) operated and non-operated wells at Valhalla in 2012.
KARR-GOLD CREEK
Paramount has assembled a land position of approximately 180 (148 net) sections at Karr-Gold Creek, located 50 km southwest of Grande Prairie. Exploration activities continued on the play during 2011, as the Company worked to optimize recovery systems and increase production from existing wells. Since commencing exploration of Karr-Gold Creek in 2008, the Company has brought 10 (9.7 net) lower Montney horizontal wells on production. To date, the performance of these wells has been below expectations, with current aggregate production averaging approximately 6 MMcf/d. A number of operational challenges in 2011 impacted the Company's effort to improve well performance, including inconsistent production resulting from multiple unplanned third party processing interruptions totalling 77 days and delays in the delivery of surface equipment.
During 2012, Paramount plans to bring three (3.0 net) lower Montney horizontal wells that were drilled during 2011 onto production and complete a previously drilled horizontal well in a Middle Montney reservoir.
The Company completed expansions to gathering and compression systems at Karr-Gold Creek during the year, with sour gas capacity being increased to 40 MMcf/d and sweet gas capacity of 8 MMcf/d. The sweet development at Karr-Gold Creek has targeted various Deep Basin Cretaceous formations and the Triassic Nikanassin formation, with ten (6.0 net) wells being drilled in 2011 and 9 (6.1 net) wells being placed on production. The sweet compression facility is operating near capacity, with five (3.5 net) wells awaiting tie-in. Two (1.5 net) sweet wells are planned to be drilled in 2012.
ANTE CREEK
Three (2.0 net) wells were drilled at Ante Creek in 2011 targeting oil from the Montney formation. The first well is producing at approximately 200 Bbl/d (100 Bbl/d net), the maximum currently permitted under regulation, a second well was dry and abandoned and a third well was completed during the first quarter of 2012. The exploration program at Ante Creek has experienced delays due to regulatory issues, production equipment failures and midstream service interruptions. Paramount anticipates developing plans for further activities at Ante Creek once the performance of the latest well is known and the regulatory matters have been successfully resolved.
| SOUTHERN | 2011 | 2010 | % Change | |
| Sales Volumes | ||||
| Natural Gas (MMcf/d) | 10.8 | 9.3 | 16 | |
| NGLs (Bbl/d) | 150 | 59 | 154 | |
| Oil (Bbl/d) | 1,483 | 1,363 | 9 | |
| Total (Boe/d) | 3,424 | 2,973 | 15 | |
| Exploration and Development Expenditures(1)($ millions) | ||||
| Exploration, drilling, completions and tie-ins | 14.9 | 9.3 | 60 | |
| Facilities and gathering | 4.7 | 2.3 | 104 | |
| 19.6 | 11.6 | 69 | ||
| Gross | Net | Gross | Net | |
| Total Land Holdings (sections) | 708 | 489 | 638 | 452 |
| Wells drilled | 22 | 12 | 27 | 17 |
(1) Before the deduction of Alberta Drilling Royalty credits.
The Southern COU operates in Southern Alberta, Saskatchewan, North Dakota and Montana. Core areas in Southern Alberta include the natural gas producing Chain-Craigmyle and Harmattan properties and the oil producing property at Enchant. In the United States, the Southern COU's core oil producing area is in North Dakota near Medora. The Southern COU's average sales volumes increased 15 percent in 2011 compared to 2010, primarily as a result of production from wells added through the ProspEx acquisition at Harmattan and Pembina.
CANADA
At Chain, 13 (13.0 net) wells were brought on production in 2011, which added new production to replace natural declines. The Company does not plan to carry out any natural gas drilling at Chain in 2012 due to the current low natural gas price environment.
During the first quarter of 2012, Paramount closed dispositions of non-core properties at West Pembina, Alberta and Kindersley, Saskatchewan for total proceeds of approximately $50 million. These properties did not have significant production volumes.
The Southern COU plans to drill up to 9 (7.5 net) oil wells in Harmattan, Enchant, Delia and Pembina in 2012.
UNITED STATES
In the United States, Paramount operates through its wholly-owned subsidiary, Summit. In February 2011, Summit sold approximately 6,000 net acres of undeveloped land in North Dakota for cash proceeds of US$40 million.
During the fourth quarter of 2011, Summit's joint venture partner drilled and completed the final earning wells under the parties' joint development agreement, earning an undivided 50 percent interest in Summit's undeveloped Bakken/Three Forks lands in North Dakota.
In the first quarter of 2012 Paramount and Summit initiated a process to sell Summit and all of its United States properties.
| NORTHERN | 2011 | 2010 | % Change | ||
| Sales Volumes | |||||
| Natural Gas (MMcf/d) | 10.3 | 12.5 | (18) | ||
| NGLs (Bbl/d) | 19 | 11 | 73 | ||
| Oil (Bbl/d) | 343 | 460 | (25) | ||
| Total (Boe/d) | 2,073 | 2,549 | (19) | ||
| Exploration and Development Expenditures(1)($ millions) | |||||
| Exploration, drilling, completions and tie-ins | 21.8 | 11.1 | 96 | ||
| Facilities and gathering | 3.4 | 1.1 | 209 | ||
| 25.2 | 12.2 | 107 | |||
| Gross | Net | Gross | Net | |
| Total Land Holdings (sections) | 959 | 592 | 820 | 530 |
| Wells drilled | 2 | 2 | 5 | 5 |
(1) Before the deduction of Alberta Drilling Royalty credits.
The Northern COU's significant properties are located in the Northwest Territories at Cameron Hills and Liard, in Alberta at Bistcho and in Northeast British Columbia at Birch and Clarke Lake. The Northern COU's average sales volumes decreased by 19 percent in 2011 compared to 2010, primarily as a result of production declines at Cameron Hills and Bistcho.
Paramount owns 60 (60 net) sections of land at Birch that are prospective for liquids-rich natural gas from the Montney formation. The Birch acreage was acquired in 2011 as part of the ProspEx acquisition and through crown land sale purchases. During the third quarter of 2011, Paramount completed its initial exploratory well with promising results, indicating significant liquid yields. The Company has secured limited access to a gathering system and the well will be brought on production in 2012. Two (2.0 net) additional wells were drilled and completed in the first quarter of 2012 and are expected to be tied-in later in the year.
STRATEGIC INVESTMENTS
OIL SANDS
In November, 2011 Paramount reorganized all of its oil sands and carbonate bitumen interests into a new wholly-owned subsidiary, Cavalier Energy and assembled its executive leadership team. The reorganization was undertaken to create a focused, self-funding oil sands entity in order to accelerate the development of Paramount's bitumen interests.
Cavalier Energy's properties include approximately 56 sections of land at Hoole, which are primarily prospective for bitumen in the Grand Rapids formation and carbonate properties, which are primarily prospective for bitumen in the Grosmont formation. The carbonate properties include approximately 15 sections of land at Saleski and 186 sections of land in other areas (the "Other Carbonate Lands"), including leases at Orchid, Granor and House. Cavalier Energy also owns approximately 18 additional sections of oil sands rights in the Athabasca oil sands area of northeastern Alberta.
During 2011, Paramount received an updated independent evaluation of the bitumen resources within the Grand Rapids formation at the Hoole oil sands property in July and an initial independent evaluation of the bitumen resources within the Grosmont formation at Saleski and the Other Carbonate Lands in November. The evaluations were conducted by the Company's independent reserves evaluator, McDaniel & Associates Consultants Ltd. ("McDaniel"). The table below summarizes the results of McDaniel's evaluation of the volumes attributable to Cavalier Energy's bitumen resources and the estimated net present value of future net revenue at Hoole:
| Other | |||
| Carbonate | |||
| Hoole(1) | Saleski(1) | Lands(1) | |
| Discovered Exploitable Bitumen In Place (3) (MBbl) | 1,631,742 | 1,184,641 | 430,586 |
| Economic Contingent Resources(2)(4) (MBbl) | 762,661 | N/A | N/A |
| Contingent Resources (Technology Under Development)(8) (MBbl) | N/A | 380,493 | 111,118 |
| NPV of Future Net Revenue (Discounted at 10%)(5) ($MM) | 2,834 | N/A | N/A |
| Undiscovered Exploitable Bitumen In Place(6) (MBbl) | N/A | 109,332 | 4,418,573 |
| Prospective Resources(7) (MBbl) | N/A | 34,006 | 1,073,439 |
MBbl means thousands of barrels.
All amounts presented in the table above are categorized as "Best Estimate".(9)
See the "Advisories" section at the end of this document for note references.
Cavalier Energy's near-term plans are to focus on the development of its 100 percent owned oil sands leases at Hoole, including finalizing the scope and design of the initial phase of the development, submitting an application for commercial development, and evaluating funding alternatives. Cavalier Energy will also continue to further delineate its carbonate bitumen leases at Saleski and the Other Carbonate Lands.
SHALE GAS
Paramount's shale gas land position encompasses 150,000 (127,000 net) acres which has potential for production from the Besa River shale gas formation in the Horn River and Liard Basins.
The Company has commenced drilling an initial vertical evaluation well in the Dunedin area of the Liard Basin of Northeast British Columbia. This well is expected to be drilled to 4,500 meters at a cost of approximately $15 million and will be cored and logged for evaluation. Paramount continues to monitor industry activities in the Horn River and Liard Basins where operators are applying multi-stage fracturing technology to maximize production rates and reserve recoveries. The Company is taking a conservative approach to de-risking its shale gas holdings in the current low natural gas price environment while taking steps to maintain its mineral rights.
INVESTMENTS IN OTHER ENTITIES
| Market Value(1) | ||||||||
| 2011 | 2010 | |||||||
| As at December 31 | Shares (000's) |
($ millions) | ($/share) | Shares (000's) |
($ millions) | ($/share) | ||
| Trilogy | 24,144(2) | $ 907.1 | 37.57 | 24,144 | $ 297.0 | 12.30 | ||
| MEG Energy Corp. | 3,700 | 153.8 | 41.57 | 3,700 | 168.3 | 45.49 | ||
| MGM Energy Corp. | 43,834 | 10.6 | 0.24 | 43,834 | 8.8 | 0.20 | ||
| Other(3) | 5.8 | 28.8 | ||||||
| Total | $ 1,077.3 | $ 502.9 | ||||||
(1) Based on the period-end closing price of publicly traded investments and book value of remaining investments.
(2) In January 2012 Paramount closed the sale of five million of its Trilogy non-voting shares for gross proceeds of $189.5 million.
(3) Includes investments in other public and private corporations.
Trilogy is a Canadian energy corporation formed through a spinout of assets from Paramount in April 2005. Originally an income trust, Trilogy converted to a corporate structure in February 2010.
Trilogy is a growing petroleum and natural gas-focused Canadian energy corporation that actively develops, produces and sells natural gas, crude oil and natural gas liquids. Trilogy's geographically concentrated assets are primarily low-risk, high working interest properties that provide abundant infill drilling opportunities and good access to infrastructure and processing facilities, many of which are operated and controlled by Trilogy.
MEG Energy Corp. ("MEG") is a public energy company based in Calgary, Alberta. MEG is an oil sands company focused on sustainable in situ oil sands development and production in the southern Athabasca region of Alberta, Canada. MEG is actively developing enhanced oil recovery projects that utilize steam assisted gravity drainage ("SAGD") extraction methods. MEG is not engaged in oil sands mining.
MEG owns a 100% working interest in over 900 sections of oil sands leases. MEG has identified two commercial SAGD projects, the Christina Lake project and the Surmont project. MEG believes that the Christina Lake project can support over 200,000 Bbl/d of sustained production for 30 years and that the Surmont project can support 100,000 Bbl/d of sustained production for over 20 years. In addition, MEG holds other leases at other properties that are in the resource definition stage and that could provide significant additional development opportunities.
Paramount acquired its ownership interest in MEG in 2007 as partial consideration for the sale of certain oil sands leases and related properties to MEG.
MGM Energy Corp. ("MGM Energy") is a Canadian energy company focused on the acquisition and development of hydrocarbon resources in the Northwest Territories. The company's business strategy is to acquire interests in prospective lands and existing discoveries in the Canadian North, and to employ current technology in exploring those lands, with the ultimate intention of developing projects that will ship hydrocarbons through the Mackenzie Valley pipeline, when built.
MGM Energy is currently active in two areas: the Mackenzie Delta, where it owns interests in six discoveries and the Colville Lake/Sahtu region of the Central Mackenzie Valley, where it owns interests in two discoveries. MGM Energy's land holdings include both Federal Lands and First Nations Oil and Gas Concessions.
MGM Energy was formed through the 2007 spinout by Paramount of certain farm-in rights and other assets in the Northwest Territories.
Paramount's wholly-owned subsidiaries, Fox Drilling and Paramount Drilling U.S. LLC, currently own three custom built triple-sized drilling rigs with diesel-electric power top drives and dual mud pumps. These rigs are designed to drill the deep horizontal wells that the industry is currently focusing on. Two of the rigs are being used in the Company's drilling program in the Kaybob COU and the third rig is contracted to third parties in the United States until mid-2012. The Company has recently commenced construction of two triple-sized walking rigs, at an estimated cost of $20 million per rig, which are expected to be available to drill on Company properties in Canada in late-2012.
OUTLOOK
Paramount plans to invest $475 million in its Principal Properties in 2012 (excluding land acquisitions and capitalized interest), primarily focused in the Kaybob COU's Deep Basin development. Construction of the Musreau and Smoky deep-cut facilities will commence during the year, and drilling and completion activities will continue in preparation for start-up in the second half of 2013. Planned 2012 activities also include drilling at Valhalla in the Grande Prairie COU and at Birch in the Northern COU.
The Company also plans to invest approximately $60 million in its Strategic Investments in 2012 to complete construction of two new triple-sized walking drilling rigs within Fox Drilling; to continue pre-development activities for oil sands projects within Cavalier Energy; and to drill a shale gas well in the Liard Basin.
Production during the first quarter of 2012 has been impacted by capacity constraints in the Kaybob COU as a result of the failure of a key electrical component at the Musreau 45 MMcf/d facility and the expiry of certain firm processing contracts in November 2011; and in the Grande Prairie COU due to delays in the delivery of surface equipment. First quarter 2012 sales volumes are expected to average approximately 18,000 Boe/d.
The Musreau facility is currently being commissioned, with gas sales expected to recommence in mid- March, and the Valhalla gas gathering system expansion and installation of surface equipment at Karr-Gold Creek are scheduled to be completed by the end of March. Sales volumes for the remainder of 2012 are forecast to range between 26,000 and 28,000 Boe/d. The Company expects its sales volumes will continue to be in this range until facility expansions at Musreau and Smoky are completed and brought on-stream in the second half of 2013.
FOURTH QUARTER REVIEW
| Net Loss | ||||||||
| Three months ended December 31 | 2011 | 2010 | ||||||
| Principal Properties | (250.3) | (84.6) | ||||||
| Strategic Investments | (3.4) | (10.9) | ||||||
| Corporate | (16.3) | (32.7) | ||||||
| Tax Recovery | 60.1 | 21.9 | ||||||
| Net Loss | (209.9) | (106.3) | ||||||
| Netback | ||||||||
| Three months ended December 31 | 2011 | 2010 | ||||||
| ($/Boe) | ($/Boe) | |||||||
| Petroleum and natural gas sales | 63.3 | 35.80 | 46.0 | 37.11 | ||||
| Royalties | (5.5) | (3.13) | (4.4) | (3.51) | ||||
| Operating expense and production tax | (21.2) | (11.98) | (12.8) | (10.37) | ||||
| Transportation | (5.1) | (2.88) | (4.3) | (3.46) | ||||
| Netback | 31.5 | 17.81 | 24.5 | 19.77 | ||||
| Financial commodity contract settlements | 0.3 | 0.17 | 1.8 | 1.44 | ||||
| Netback including financial commodity contract | ||||||||
| settlements | 31.8 | 17.98 | 26.3 | 21.21 | ||||
| Funds Flow from Operations | ||
| Three months ended December 31 | 2011 | 2010 |
| Cash from operating activities | 7.2 | 10.4 |
| Change in non-cash working capital | 14.9 | 8.8 |
| Geological and geophysical expenses | 1.9 | 1.5 |
| Asset retirement obligations settled | 2.1 | 0.6 |
| Funds flow from operations | 26.1 | 21.3 |
| Funds flow from operations ($/Boe) | 19.77 | 17.17 |
| Sales Volumes | Three months ended December 31 | |||||||||||||||
| Natural Gas (MMcf/d) | NGLs (Bbl/d) | Oil (Bbl/d) | Total (Boe/d) | |||||||||||||
| 2011 | 2010 | Change% | 2011 | 2010 | Change% | 2011 | 2010 | Change% | 2011 | 2010 | Change% | |||||
| Kaybob | 50.8 | 28.8 | 76 | 901 | 614 | 47 | 62 | 98 | (37) | 9,437 | 5,506 | 71 | ||||
| Grande Prairie | 19.4 | 11.4 | 70 | 480 | 333 | 44 | 333 | 428 | (22) | 4,048 | 2,667 | 52 | ||||
| Southern | 11.4 | 9.1 | 25 | 216 | 59 | 266 | 1,551 | 1,397 | 11 | 3,670 | 2,976 | 23 | ||||
| Northern | 9.9 | 11.1 | (11) | 23 | 24 | (4) | 410 | 434 | (6) | 2,068 | 2,312 | (11) | ||||
| 91.5 | 60.4 | 51 | 1,620 | 1,030 | 57 | 2,356 | 2,357 | 0 | 19,223 | 13,461 | 43 | |||||
Paramount's fourth quarter average sales volumes were 19,223 Boe/d, consisting of 91.5 MMcf/d of natural gas and 3,976 Bbl/d of oil and NGLs. Petroleum and natural gas sales were $63.3 million, an increase of $17.3 million from the fourth quarter of 2010 due to increased production volumes from new wells and acquisitions and higher oil and NGLs prices, partially offset by lower natural gas prices. Production levels in the Kaybob COU in the fourth quarter of 2011 were impacted by lower firm processing capacity in Musreau and equipment failures shortly after the start-up of the new Musreau plant resulting in some production being temporarily shut-in.
Fourth quarter 2011 royalties increased to $5.5 million in 2011 compared to $4.4 million in 2010, primarily as a result of increased revenue. The average royalty rate decreased from 9.3% to 8.7%, as a greater proportion of current production is subject to the Alberta new well and deep drilling royalty incentive programs. Operating expenses were $8.4 million higher in the fourth quarter of 2011 compared to the prior year primarily due to higher production volumes from new well production and acquisitions. Operating costs per Boe increased to $11.98 in the fourth quarter of 2011 compared to $10.37 in the fourth quarter of 2010. The per unit increase is due primarily to an equalization adjustment for processing fees at a third party midstream facility and higher 2011 costs related to winter ice roads and well work-overs.
Funds flow from operations in the fourth quarter of 2011 increased by $4.8 million to $26.1 million compared to $21.3 million in 2010, primarily due to the increase in petroleum and natural gas sales, partially offset by higher operating expenses and interest.
Fourth quarter exploration and development expenditures of $78.1 million were primarily related to the Deep Basin development in the Kaybob COU and spending at Karr-Gold Creek and Valhalla in the Grande Prairie COU.
RESERVES
Paramount's estimated proved reserve volumes increased by 39 percent to 35.7 MMBoe at December 31, 2011 compared to 25.6 MMBoe in the prior year. The Company's estimated proved and probable reserve volumes increased by 32 percent to 53.0 MMBoe at December 31, 2011 compared to 40.1 MMBoe in the prior year. The Company achieved a 193 percent reserves replacement ratio on a proved and probable basis, excluding acquisitions. New reserves were added primarily at Musreau, Resthaven and Smoky in the Kaybob COU and from the ProspEx acquisition, partially offset by negative price revisions due to a 22 percent decline in forecast natural gas prices compared to December 2010 and technical revisions due to well performance in certain properties within the Grande Prairie and Northern COUs.
Paramount's reserves for the year ended December 31, 2011 were evaluated by McDaniel and prepared in accordance with National Instrument 51-101 definitions, standards and procedures. The Company's working interest reserves and before tax net present value of future net revenues for the year ended December 31, 2011 using forecast prices and costs are as follows:
| Gross Proved and Probable Reserves(1) | Before Tax Net Present Value(1) | ||||||||||||||
| ($ millions) | |||||||||||||||
| Natural Gas |
Light & Medium Crude Oil |
Natural Gas Liquids |
Total | Discount Rate |
|||||||||||
| Reserves Category | (Bcf) | (MBbl) | (MBbl) | (MBoe)(2) | 0% | 10% | 15% | ||||||||
| Canada | |||||||||||||||
| Proved | |||||||||||||||
| Developed Producing | 120.4 | 1,930 | 2,381 | 24,375 | 565.3 | 420.4 | 374.8 | ||||||||
| Developed Non-producing | 30.6 | 241 | 1,128 | 6,469 | 147.9 | 101.3 | 88.6 | ||||||||
| Undeveloped | 10.5 | - | 216 | 1,964 | 33.1 | 21.8 | 18.2 | ||||||||
| Total Proved | 161.5 | 2,171 | 3,725 | 32,808 | 746.3 | 543.5 | 481.6 | ||||||||
| Total Probable | 82.0 | 981 | 1,941 | 16,588 | 428.7 | 204.2 | 155.3 | ||||||||
| Total Proved plus Probable | |||||||||||||||
| Canada | 243.5 | 3,152 | 5,665 | 49,395 | 1,175.1 | 747.7 | 636.9 | ||||||||
| United States | |||||||||||||||
| Proved | |||||||||||||||
| Developed Producing | 0.5 | 2,702 | 75 | 2,858 | 109.1 | 68.3 | 58.2 | ||||||||
| Developed Non-producing | - | - | - | - | (0.4) | (0.3) | (0.3) | ||||||||
| Undeveloped | - | - | - | - | - | - | - | ||||||||
| Total Proved | 0.5 | 2,702 | 75 | 2,858 | 108.7 | 68.0 | 57.9 | ||||||||
| Total Probable | 0.1 | 719 | 20 | 762 | 41.9 | 16.5 | 12.3 | ||||||||
| Total Proved plus Probable USA | 0.6 | 3,421 | 95 | 3,620 | 150.5 | 84.5 | 70.2 | ||||||||
| Total Company | |||||||||||||||
| Total Proved | 162.0 | 4,874 | 3,799 | 35,665 | 855.0 | 611.4 | 539.5 | ||||||||
| Total Probable | 82.1 | 1,699 | 1,961 | 17,349 | 470.6 | 220.7 | 167.6 | ||||||||
| Total Proved plus Probable | 244.1 | 6,573 | 5,760 | 53,015 | 1,325.6 | 832.2 | 707.0 | ||||||||
(1) Columns may not add due to rounding.
(2) Refer to the oil and gas measures and definitions in the "Advisories" section of this document.
Reserves Reconciliation
| Proved Reserves(1) | Probable Reserves(1) | Proved & Probable Reserves(1) |
||||||||||||||||
| Natural Gas |
Oil and NGLs |
Total | Natural Gas |
Oil and NGLs |
Total | Natural Gas |
Oil and NGLs |
Total | ||||||||||
| (Bcf) | (MBbl) | (MBoe)(2) | (Bcf) | (MBbl) | (MBoe)(2) | (Bcf) | (MBbl) | (MBoe)(2) | ||||||||||
| January 1, 2011 | 112.0 | 6,906 | 25,576 | 69.8 | 2,876 | 14,511 | 181.8 | 9,782 | 40,087 | |||||||||
| Extensions & discoveries | 53.2 | 2,364 | 11,237 | 25.9 | 1,374 | 5,693 | 79.2 | 3,737 | 16,930 | |||||||||
| Technical revisions | 9.5 | (15) | 1,576 | (13.0) | (831) | (2,994) | (3.4) | (846) | (1,418) | |||||||||
| Economic factors | (8.5) | (104) | (1,522) | (9.8) | (49) | (1,690) | (18.4) | (154) | (3,212) | |||||||||
| Acquisitions | 25.6 | 929 | 5,199 | 9.2 | 293 | 1,833 | 34.9 | 1,221 | 7,032 | |||||||||
| Dispositions | (0.2) | (8) | (40) | - | (1) | (4) | (0.2) | (9) | (44) | |||||||||
| Production | (29.8) | (1,399) | (6,360) | - | - | - | (29.8) | (1,399) | (6,360) | |||||||||
| December 31, 2011 | 162.0 | 8,673 | 35,666 | 82.1 | 3,660 | 17,349 | 244.1 | 12,333 | 53,015 | |||||||||
(1) Columns and rows may not add due to rounding.
(2) Refer to the oil and gas measures and definitions in the "Advisories" section of this document.
Capital Expenditures
| Year ended December 31 | 2011 | 2010 |
| Geological and geophysical | 5.5 | 7.6 |
| Drilling, completion and tie-ins | 303.7 | 144.8 |
| Facilities and gathering | 156.5 | 46.6 |
| Exploration and development expenditures | 465.7 | 199.0 |
| Land and property acquisitions | 38.2 | 82.7 |
| Principal Properties | 503.9 | 281.7 |
| Strategic Investments | 28.0 | 16.3 |
| Corporate | 0.1 | 0.1 |
| 532.0 | 298.1 |
(1) Exploration and development expenditures are presented after the deduction of Alberta Drilling Royalty credits
| Finding and Development Costs | |||||||||||||
| Total Company | |||||||||||||
| Exploration & | Reserve | Finding & | |||||||||||
| Development | Additions(2) | Development | |||||||||||
| Capital(1) | Costs(2) | ||||||||||||
| Proved | Proved Plus Probable |
Proved | Proved Plus Probable |
Proved | Proved Plus Probable |
||||||||
| ($ millions) | ($ millions) | (Mboe) | (Mboe) | ($/Boe) | ($/Boe) | ||||||||
| Exploration, drilling, completions and tie-ins | 309.2 | 309.2 | |||||||||||
| Change in future capital | 3.6 | (11.6) | |||||||||||
| 312.8 | 297.6 | 11,291 | 12,300 | 27.70 | 24.19 | ||||||||
| Facilities and gathering | 156.5 | 156.5 | - | - | |||||||||
| Total finding and development capital | 469.3 | 454.1 | 11,291 | 12,300 | 41.57 | 36.92 | |||||||
(1) The aggregate of the exploration and development costs incurred in the most recent financial year and the change during that year in estimated future development costs generally will not reflect total finding and development costs related to reserve additions for that year.
(2) Refer to the oil and gas measures and definitions in the "Advisories" section of this document.
| Total finding and development costs by year ($/Boe) | ||||
| 3 Year | ||||
| 2011 | 2010 | 2009 | Average | |
| Finding and development costs before facilities expenditures | ||||
| Proved | $ 27.70 | $ 21.04 | $ 18.47 | $ 24.03 |
| Proved plus Probable | $ 24.19 | $ 20.76 | $ 19.07 | $ 22.45 |
| Finding and development costs including facilities expenditures | ||||
| Proved | $ 41.57 | $ 27.45 | $ 24.05 | $ 34.12 |
| Proved plus Probable | $ 36.92 | $ 26.91 | $ 26.76 | $ 32.38 |
Finding and development costs in 2011 were impacted by technical revisions at Karr-Gold Creek and Valhalla in the Grande Prairie COU and at the Nahanni property in the Northern COU.
Finding and development costs for the Kaybob COU, where Paramount is currently focused in developing a large-scale liquids rich play were $13.57 on a proved plus probable basis (excluding facilities and gathering expenditures):
Kaybob COU
| Exploration & | Finding & | ||||||||||||
| Development | Reserve | Development | |||||||||||
| Capital(1) | Additions(2) | Costs(2) | |||||||||||
| Proved | Proved Plus Probable |
Proved | Proved Plus Probable |
Proved | Proved Plus Probable |
||||||||
| ($ millions) | ($ millions) | (Mboe) | (Mboe) | ($/Boe) | ($/Boe) | ||||||||
| Exploration, drilling, completions and tie-ins | 171.2 | 171.2 | |||||||||||
| Change in future capital | 6.4 | (15.3) | |||||||||||
| 177.6 | 155.9 | 9,947 | 11,481 | 17.85 | 13.57 | ||||||||
| Facilities and gathering | 91.6 | 91.6 | - | - | |||||||||
| Total finding and development capital | 269.2 | 247.5 | 9,947 | 11,481 | 27.06 | 21.56 | |||||||
(1) The aggregate of the exploration and development costs incurred in the most recent financial year and the change during that year in estimated future development costs generally will not reflect total finding and development costs related to reserve additions for that year.
(2) Refer to the oil and gas measures and definitions in the "Advisories" section of this document.
| Total finding and development costs by year ($/Boe) | ||||
| 3 Year | ||||
| 2011 | 2010 | 2009 | Average | |
| Finding and development costs before facilities expenditures | ||||
| Proved | $ 17.85 | $ 15.79 | $ 15.72 | $ 17.11 |
| Proved plus Probable | $ 13.57 | $ 13.18 | $ 15.58 | $ 13.71 |
| Finding and development costs including facilities expenditures | ||||
| Proved | $ 27.06 | $ 19.63 | $ 22.60 | $ 24.73 |
| Proved plus Probable | $ 21.56 | $ 16.30 | $ 20.44 | $ 20.05 |
LAND
| 2011 | 2010 | |||||
| (000's of acres) | ||||||
| Average | Average | |||||
| Working | Working | |||||
| Gross(1) | Net(2) | Interest | Gross(1) | Net(2) | Interest | |
| Undeveloped land | 1,736 | 1,225 | 71% | 1,682 | 1,198 | 71% |
| Acreage assigned reserves | 574 | 334 | 58% | 580 | 311 | 54% |
| 2,310 | 1,559 | 67% | 2,262 | 1,509 | 67% | |
| Value of undeveloped land(3) ($ millions) | $ 224.3 | $ 236.3 |
(1) "Gross" acres means the total acreage in which Paramount has an interest.
(2) "Net" acres means Paramount's gross working interest acres multiplied by Paramount's working interest therein.
(3) Based on McDaniel's Evaluation of Unproven Acreage Interests.
ADDITIONAL INFORMATION
A copy of this press release in PDF format can be obtained at download/2012+March+6_release.pdf. Paramount's Management's Discussion and Analysis for the year ended December 31, 2011 can be found at download/2012+March+6_md%26a.pdf and the Company's Consolidated Financial Statements for the year ended December 31, 2011 can be obtained at download/2012+March+6_consolidated_financial_statements.pdf. This information will also be made available through Paramount's website at www.paramountres.com and SEDAR at www.sedar.com.
Paramount will file its Annual Information Form ("AIF") for the year ended December 31, 2011, which includes the disclosure and reports relating to reserves data and other oil and gas information required pursuant to National Instrument 51-101, shortly.
ABOUT PARAMOUNT
Paramount Resources Ltd. is a Canadian oil and natural gas exploration, development and production company with operations focused in Western Canada. Paramount's common shares are listed on the Toronto Stock Exchange under the symbol "POU".
ADVISORIES
FORWARD-LOOKING INFORMATION
Certain statements in this document constitute forward-looking information under applicable securities legislation. Forward-looking information typically contains statements with words such as "anticipate", "believe", "estimate", "expect", "plan", "intend", "propose", or similar words suggesting future outcomes or an outlook. Forward looking information in this document includes, but is not limited to:
- expected production volumes and the timing thereof;
- planned exploration and development expenditures and the timing thereof;
- exploration and development potential and/or plans and strategies and the anticipated costs and results thereof;
- budget allocations and capital spending flexibility;
- adequacy of facilities to process and transport natural gas production;
- the scope and timing of proposed new facilities and expansions to existing facilities and the expected capacity and utilization of such facilities;
- estimated reserves and resources and the undiscounted and discounted present value of future net revenues from such reserves and resources (including the forecast prices and costs and the timing of expected production volumes and future development capital);
- timing of regulatory applications;
- the timing of the anticipated development of Paramount's oil sands, carbonate and shale gas assets;
- ability to fulfill future pipeline transportation commitments;
- future taxes payable or owing;
- undeveloped land lease expiries;
- timing and cost of future abandonment and reclamation;
- business strategies and objectives;
- sources of and plans for financing;
- acquisition and disposition plans;
- operating and other costs and royalty rates;
- regulatory applications and the anticipated timing, results and scope thereof;
- anticipated increases in future reserves estimates;
- expected drilling programs, well tie-ins, facility construction and expansions, completions and the timing thereof; and
- the outcome of any legal claims, audits, assessments or other regulatory matters or proceedings.
Such forward-looking information is based on a number of assumptions which may prove to be incorrect. The following assumptions have been made, in addition to any other assumptions identified in this document:
- future crude oil, bitumen, natural gas and NGLs prices and general economic, business conditions, and market conditions;
- the ability of Paramount to obtain required capital to finance its exploration, development and operations;
- the ability of Paramount to obtain equipment, services, supplies and personnel in a timely manner and at an acceptable cost to carry out its activities;
- the ability of Paramount to market its oil and natural gas successfully to current and new customers;
- the ability of Paramount to secure adequate product processing, transportation and storage;
- the ability of Paramount and its industry partners to obtain drilling success consistent with expectations;
- the timely receipt of required regulatory approvals;
- expected timelines being met in respect of facility development and construction projects;
- access to capital markets and other sources of funding;
- well economics relative to other projects; and
- currency exchange and interest rates.
Although Paramount believes that the expectations reflected in such forward looking information is reasonable, undue reliance should not be placed on it as Paramount can give no assurance that such expectations will prove to be correct. Forward-looking information is based on current expectations, estimates and projections that involve a number of risks and uncertainties which could cause actual results to differ materially from those anticipated by Paramount and described in the forward looking information. These risks and uncertainties include, but are not limited to:
- fluctuations in crude oil, bitumen, natural gas and NGLs prices, foreign currency exchange rates and interest rates;
- the uncertainty of estimates and projections relating to future revenue, future production, costs and expenses and the timing thereof;
- the ability to secure adequate product processing, transportation and storage;
- the uncertainty of exploration, development and drilling activities;
- operational risks in exploring for, developing and producing crude oil and natural gas, and the timing thereof;
- the ability to obtain equipment, services, supplies and personnel in a timely manner and at an acceptable cost;
- potential disruptions or unexpected technical difficulties in designing, developing or operating new, expanded or existing facilities including, third party facilities that service Company production;
- risks and uncertainties involving the geology of oil and gas deposits;
- the uncertainty of reserves and resource estimates;
- the ability to generate sufficient cash flow from operations and other sources of financing at an acceptable cost to meet current and future obligations, including costs of anticipated projects;
- changes to the status or interpretation of laws, regulations or policies;
- changes in environmental laws including emission reduction obligations;
- the receipt, timing, and scope of governmental or regulatory approvals;
- changes in economic, business and market conditions;
- uncertainty regarding aboriginal land claims and co-existing with local populations;
- the effects of weather;
- the ability to fund exploration, development and operational activities and meet current and future obligations;
- the timing and cost of future abandonment and reclamation activities;
- cleanup costs or business interruptions due to environmental damage and contamination;
- the ability to enter into or continue leases;
- existing and potential lawsuits and regulatory actions; and
- other risks and uncertainties described elsewhere in this document and in Paramount's other filings with Canadian securities authorities, including its Annual Information Form.
The foregoing list of risks is not exhaustive. Additional information concerning these and other factors which could impact Paramount are included in Paramount's most recent Annual Information Form. The forward-looking information contained in this document is made as of the date hereof and, except as required by applicable securities law, Paramount undertakes no obligation to update publicly or revise any forward-looking statements or information, whether as a result of new information, future events or otherwise.
NON-GAAP MEASURES
In this document "Funds flow from operations", "Funds flow from operations - per Boe", "Funds flow from operations per share - diluted", "Netback", "Net Debt", "Exploration and development expenditures" and "Investments in other entities - market value", collectively the "Non-GAAP measures", are used and do not have any standardized meanings as prescribed by GAAP.
The Company has adjusted its funds flow from operations measure for all periods subsequent to exclude asset retirement obligation settlements, cash outflows related to the purchase of Paramount's Common Shares under the Company's stock incentive plan and the effect of changes in foreign exchange rates in respect of foreign currency cash and cash equivalent balances. Funds flow from operations refers to cash from operating activities before net changes in operating non-cash working capital, geological and geophysical expenses and asset retirement obligation settlements. Funds flow from operations is commonly used in the oil and gas industry to assist management and investors in measuring the Company's ability to fund capital programs and meet financial obligations.
Netback equals petroleum and natural gas sales less royalties, operating costs, production taxes and transportation costs. Netback is commonly used by management and investors to compare the results of the Company's oil and gas operations between periods. Net Debt is a measure of the Company's overall debt position after adjusting for certain working capital amounts and is used by management to assess the Company's overall leverage position. Refer to the calculation of Net Debt in the liquidity and capital resources section of Management's Discussion and Analysis. Exploration and development expenditures refer to capital expenditures incurred by the Company's COUs (excluding land and acquisitions). The exploration and development expenditure measure provides management and investors with information regarding the Company's Principal Property spending on drilling and infrastructure projects, separate from land acquisition activity.
Investments in other entities - market value reflects the Company's investments in enterprises whose securities trade on a public stock exchange at their period end closing price (e.g. Trilogy, MEG, MGM Energy and others), and investments in all other entities at book value. Paramount provides this information in its MD&A because the market values of equity-accounted investments, which are significant assets of the Company, are often materially different than their carrying values.
Non-GAAP measures should not be considered in isolation or construed as alternatives to their most directly comparable measure calculated in accordance with GAAP, or other measures of financial performance calculated in accordance with GAAP. The Non-GAAP measures are unlikely to be comparable to similar measures presented by other issuers.
OIL AND GAS MEASURES AND DEFINITIONS
This document contains disclosures expressed as "Boe" and "Boe/d". All oil and natural gas equivalency volumes have been derived using the ratio of six thousand cubic feet of natural gas to one barrel of oil. Equivalency measures may be misleading, particularly if used in isolation. A conversion ratio of six thousand cubic feet of natural gas to one barrel of oil is based on an energy equivalency conversion method primarily applicable at the burner tip and does not represent a value equivalency at the well head. The term "liquids" is used to represent oil, natural gas liquids ("NGLs") and condensate. The term "liquids-rich" is used to represent natural gas streams with associated liquids volumes.
For fiscal 2011, the value ratio between crude oil and natural gas was approximately 23:1. This value ratio is significantly different from the energy equivalency ratio of 6:1. Using a 6:1 ratio would be misleading as an indication of value.
The reserves replacement disclosure herein was calculated as the net increase in proved and probable reserves estimates from extensions and discoveries, technical revisions and economic factors divided by the total production in the year.
NOTES
(1) Hoole was evaluated by McDaniel as of April 30, 2011. Saleski and the Other Carbonate Lands were evaluated by McDaniel as of October 31, 2011.
(2) Contingent Resources are those quantities of bitumen estimated, as of a given date, to be potentially recoverable from known accumulations using established technology or technology under development, but are classified as a resource rather than a reserve due to one or more contingencies, such as the absence of regulatory approvals, detailed design estimates or near term development plans. There is no certainty that it will be commercially viable to produce any portion of the contingent resources. For the Hoole oil sands property, contingencies which must be overcome to enable the reclassification of bitumen contingent resources as reserves include the finalization of plans for the initial development, a regulatory application submission with no major issues raised, access to capital markets and other sources of funding and management's intent to proceed evidenced by a development plan with major capital expenditures. Economic Contingent Resources are those Contingent Resources that are economically recoverable based on specific forecasts of commodity prices and costs (based on McDaniel's forecast prices and costs as of April 1, 2011).
(3) Discovered Exploitable Bitumen In Place is the estimated volume of bitumen, as of a given date, which is contained in a subsurface stratigraphic interval of a known accumulation that meets or exceeds certain reservoir characteristics, such as minimum continuous net pay, porosity and mass bitumen content. For the Hoole oil sands property, the presence of these characteristics is considered necessary for the commercial application of known recovery technologies. For the Saleski property and the Other Carbonate Lands, these volumes have been constrained to areas that have a minimum thickness of 10 meters of substantially clean, continuous predominantly bitumen-saturated carbonate with log porosity meeting a minimum of 10 percent and bitumen saturation greater than 50 percent, respectively and with both competent top and lateral reservoir containment. These carbonate bitumen resources are constrained to one mile in area around known data points that penetrate the zone and possess definitive geophysical log data. Discovered Exploitable Bitumen in Place for the Saleski property and the Other Carbonate Lands may be assigned outside of the one mile area if reservoir continuity between offsetting delineation is expected. The technology required to economically produce bitumen from carbonate formations is currently in the development stage and has not been proven on a commercial scale. There is no certainty that it will be commercially viable to produce any portion of the resources from the Hoole oil sands property, the Saleski property or the Other Carbonate Lands.
(4) Represents the Company's share of recoverable volumes before deduction of royalties. In the assessment of Economic Contingent Resources, McDaniel used a minimum net pay cut-off of 10 meters in the best estimate case.
(5) NPV means net present value and represents the Company's share of future net revenue, before the deduction of income tax from the Economic Contingent Resources in the Grand Rapids formation within the Hoole oil sands property. The calculation considers such items as revenues, royalties, operating costs, abandonment costs and capital expenditures. Royalties have been calculated based on Alberta's Royalty Framework applicable to oil sands projects in Alberta. The calculation does not consider financing costs and general and administrative costs. NPVs were calculated assuming natural gas is used as a fuel for steam generation. Revenues and expenditures were calculated based on McDaniel's forecast prices and costs as of April 1, 2011. The estimated net present values disclosed in this press release do not represent fair market value.
(6) Undiscovered Exploitable Bitumen In Place is the volume of petroleum estimated, as of a given date, to be contained in accumulations yet to be discovered. These resources are mapped using known data points penetrating the zone and possess definitive geophysical log data along with seismic data and regional mapping. There is no certainty that any portion of the resources will be discovered. If discovered, there is no certainty that it will be commercially viable to produce any portion of the resources.
(7) Prospective Resources are those quantities of bitumen estimated, as of a given date, to be potentially recoverable from undiscovered accumulations by application of future development projects. Prospective resources have both an associated chance of discovery and a chance of development. Prospective Resources have not been, and may never be, discovered.
(8) Contingent Resources/Technology Under Development are those quantities of bitumen estimated, as of a given date, to be potentially recoverable from known accumulations using established technology or technology under development, but are classified as a resource rather than a reserve due to one or more contingencies, such as the absence of regulatory approvals, detailed design estimates or near term development plans. There is no certainty that it will be commercially viable to produce any portion of the contingent resources. For the Saleski property and the Other Carbonate Lands, because of the lack of demonstrated commercial SAGD production within carbonate reservoirs, the recoverable resources assigned are contingent upon successful application of SAGD to the subject reservoir or a reasonable analog. The successful implementation of SAGD technology in carbonate reservoirs is a significant contingency associated with these assignments that separate them from typical McMurray clastic SAGD contingent and prospective resources, where the technology has been proven effective. In addition to the technical contingency, additional contingencies applicable to the carbonate resources include being in the early evaluation stage, the economic viability of development and the absence of regulatory approvals. The economic status of these resources are undetermined.
(9) Best Estimate is considered to be the best estimate of the quantity of resources that will actually be recovered. It is equally likely that the actual remaining quantities recovered will be greater or less than the best estimate. Those resources that fall within the best estimate have a 50 percent confidence level that the actual quantities recovered will equal or exceed the estimate.
TEST RESULTS
Test rates disclosed in this document represent the average rate of gas-flow during post clean-up production tests at the largest choke setting up 4 1/2" casing. All wells were stimulated using frac oil and substantially all fluids recovered during the test periods were load fluids. As a result, recovered fluid volumes for the duration of the tests have not been disclosed. Pressure transient analyses and well-test interpretations have not been carried out for the wells disclosed and as such, data should be considered to be preliminary until such analysis or interpretation has been done. Test results are not necessarily indicative of long-term performance or of ultimate recovery. Liquids yields under the heading "Average Sales Volumes" are presented for the period following recovery of all load fluids. Liquids yields are not presented where recovery of load fluids is incomplete.

